Overview
The Kanban board in TeamTrace shows your project's work as cards that move across columns, one column for each status. Next to the board, the project dashboard summarizes how the project is doing, with charts for statuses and priorities, a list of overdue tickets, and workload and progress per person. This article is a tour of both screens and what each part shows.
Open the Kanban Board
- Click Projects and open your project.
- Open the Task tab.
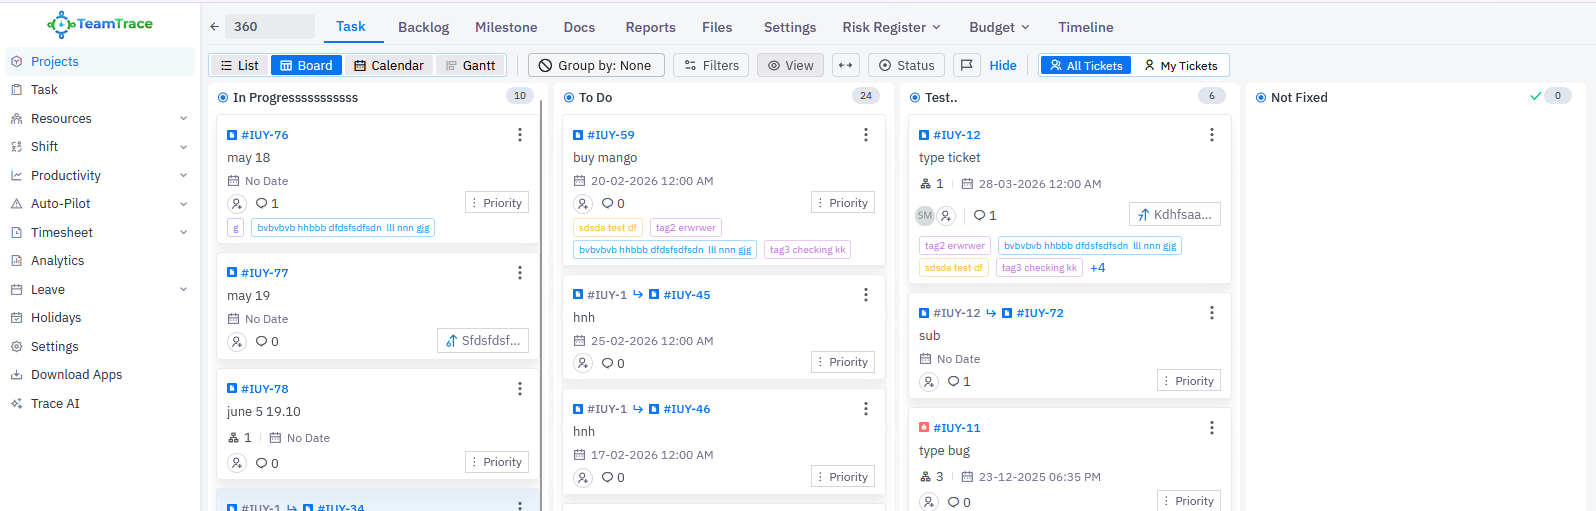
- Select the Board view. The other views next to it are Home, List, Calendar and Gantt.
Project Tabs
At the top of a project you will see these tabs: Task, Backlog, Milestone, Docs, Files, Reports, Settings, Risk Register, Budget and Timeline. The Quick Add button at the top right lets you add items quickly.
Part 1: The Kanban Board
Columns
Each column is a status, such as To Do, In Progress and Done. The number at the top of a column shows how many cards are in it. Columns follow the order of your project's statuses, and you can change them from the Status button in the toolbar. See Task Statuses Explained in TeamTrace.
Cards
Each card is a task. A card can show:
| Card element | What it shows |
| Priority label | The task's priority, such as Medium or High. A task with no priority shows a "Priority" placeholder. |
| Task number | The task's ID, such as #1118. Click it to open the task. |
| Title | The task name. |
| Date | The task's date and time, or "No Date" if none is set. |
| Subtask count | The number of subtasks, when the task has any. |
| Assignee | The person the task is assigned to. |
| Comment count | The number of comments on the task. |
| Tags | The tags added to the task. |
| Linked task ID | When a task is linked to another task, the linked task's ID appears next to its own. See Task Dependencies Explained in TeamTrace. |
Toolbar
| Control | What it does |
| Home, List, Board, Calendar, Gantt | Switch between views of the same project. |
| Group by | Group the cards on the board. It shows None by default. |
| Filters | Show only the tasks that match your criteria. |
| View | Change how the board is displayed, and use saved views. |
| Status | Open the Project Status Column window, to edit, delete or add statuses. |
| All Tickets / My Tickets | Switch between every task in the project and only your own. |
Work with cards
- Move a card: drag and drop it into another column to change its status.
- Open a card: click it to see the task details, comments, history, work log and subtasks.
- Use the three-dot menu: choose Update, Delete, Clone or Move Task. See How to Edit a Task in TeamTrace.
- Final status: cards moved to a status marked Final shift to the end of the board, which keeps active work front and center.
Part 2: The Project Dashboard
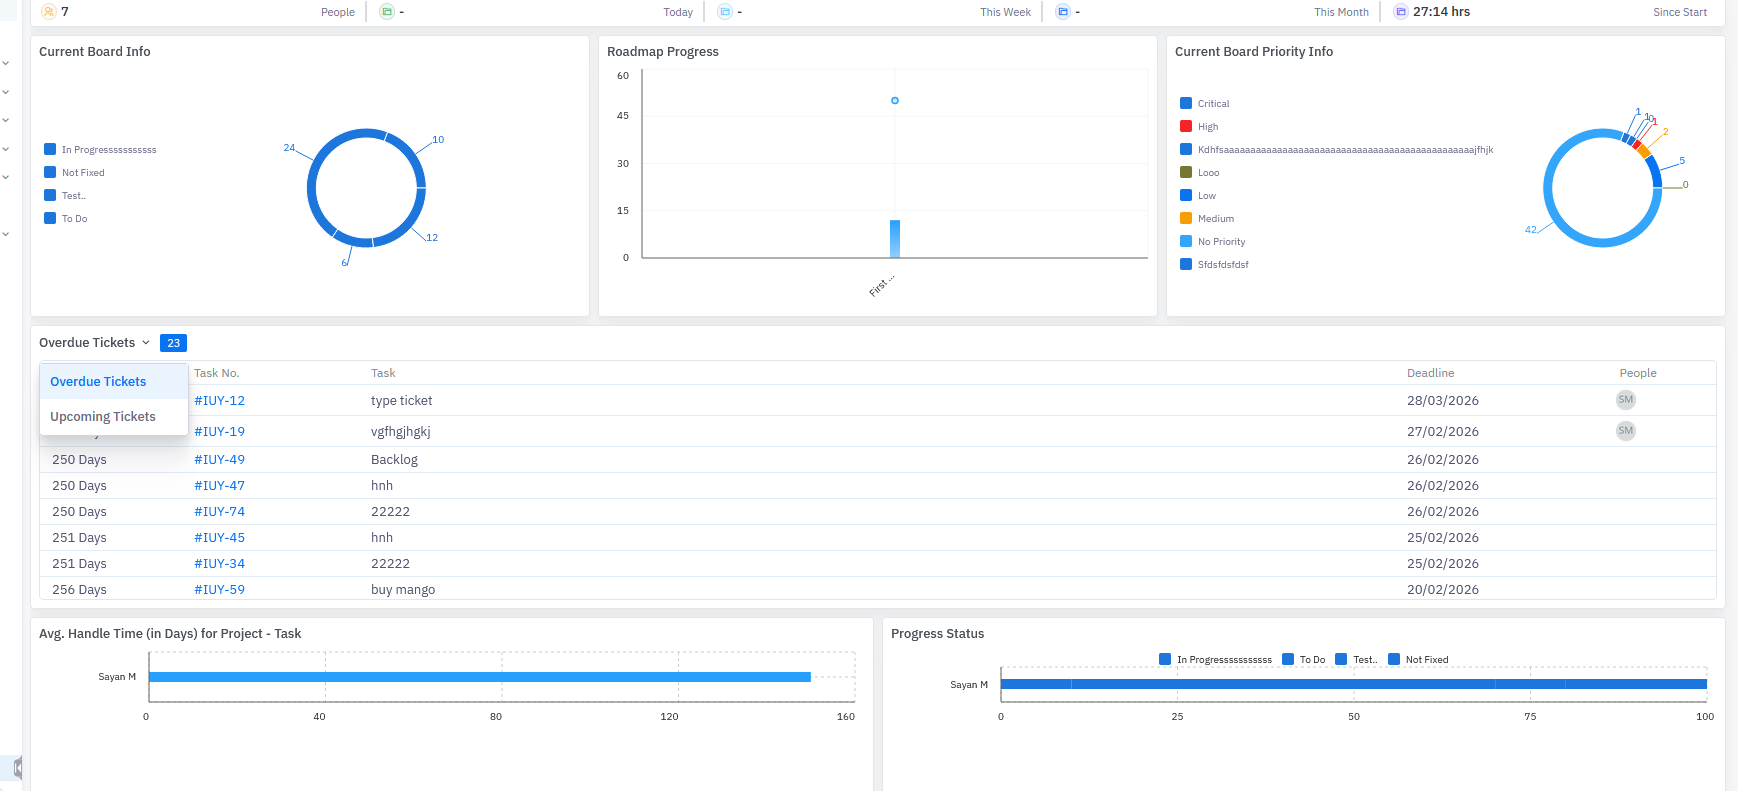
The dashboard gives you a quick picture of the whole project. It has a summary strip at the top, followed by charts and lists.
Summary strip
A row of figures at the top shows:
- People: the number of people in the project.
- Today, This Week and This Month: the time logged in each period.
- Since Start: the total time logged since the project began, for example 27:14 hrs.
Dashboard widgets
| Widget | What it shows | How to use it |
| Current Board Info | A donut chart of the number of tasks in each status, such as In Progress, Not Fixed, Test and To Do. | See at a glance where work stands, and which status holds the most tasks. |
| Roadmap Progress | A chart of progress against the project's roadmap. | Check how the project is moving towards its milestones. |
| Current Board Priority Info | A donut chart of the number of tasks at each priority level, such as Critical, High, Medium, Low and No Priority. | Check whether the most urgent work is getting attention. |
| Overdue Tickets | A table of tasks past their deadline. It shows how many days overdue each task is, the task number and name, its deadline and the people involved. A badge shows the total count. | Find late tasks and follow them up. |
| Avg. Handle Time (in Days) for Project – Task | A bar chart with the average number of days each person takes to handle tasks. | Spot who is taking longer or finishing faster. |
| Progress Status | A stacked bar for each person, showing how their tasks are split across the statuses. | See each person's progress at a glance. |
Using the Board and Dashboard Together
- Start on the dashboard to see where the project stands and what is overdue.
- Open the board to act on it: move cards, reassign work and unblock tasks.
- Check the status chart to find columns that are filling up. These may be bottlenecks.
- Use the Progress Status and handle time charts to balance work between people.
- Open the Reports tab for more detail. See Kanban in TeamTrace: A Beginner's Guide.
Notes
- The statuses and priorities shown in the charts are the ones set up for your project, so they may differ from the examples here.
- You can see the Screenshots and some time information only if your role allows it. See TeamTrace Roles and Permission Matrix.
Troubleshooting
| Problem | What to check |
| I can't see the Board view | Open the project's Task tab, and select Board next to List, Calendar and Gantt. |
| I can't see all tasks on the board | Check that All Tickets is selected rather than My Tickets, and check your filters. |
| The dashboard charts are empty | A new project has no data until tasks are added and time is tracked. |
| A card won't move to another column | The task may be blocked by a linked task, or the status may be limited to a specific role. |
| A status or priority is missing from a chart | Charts only show statuses and priorities that have tasks in them. |
Related Articles
Was this article helpful?
That’s Great!
Thank you for your feedback
Sorry! We couldn't be helpful
Thank you for your feedback
Feedback sent
We appreciate your effort and will try to fix the article